The CFO Line Flipped Back to Wait — $1.26B in ETF Outflows, Demand at 2026 Lows, and the Math Behind What Happens Next

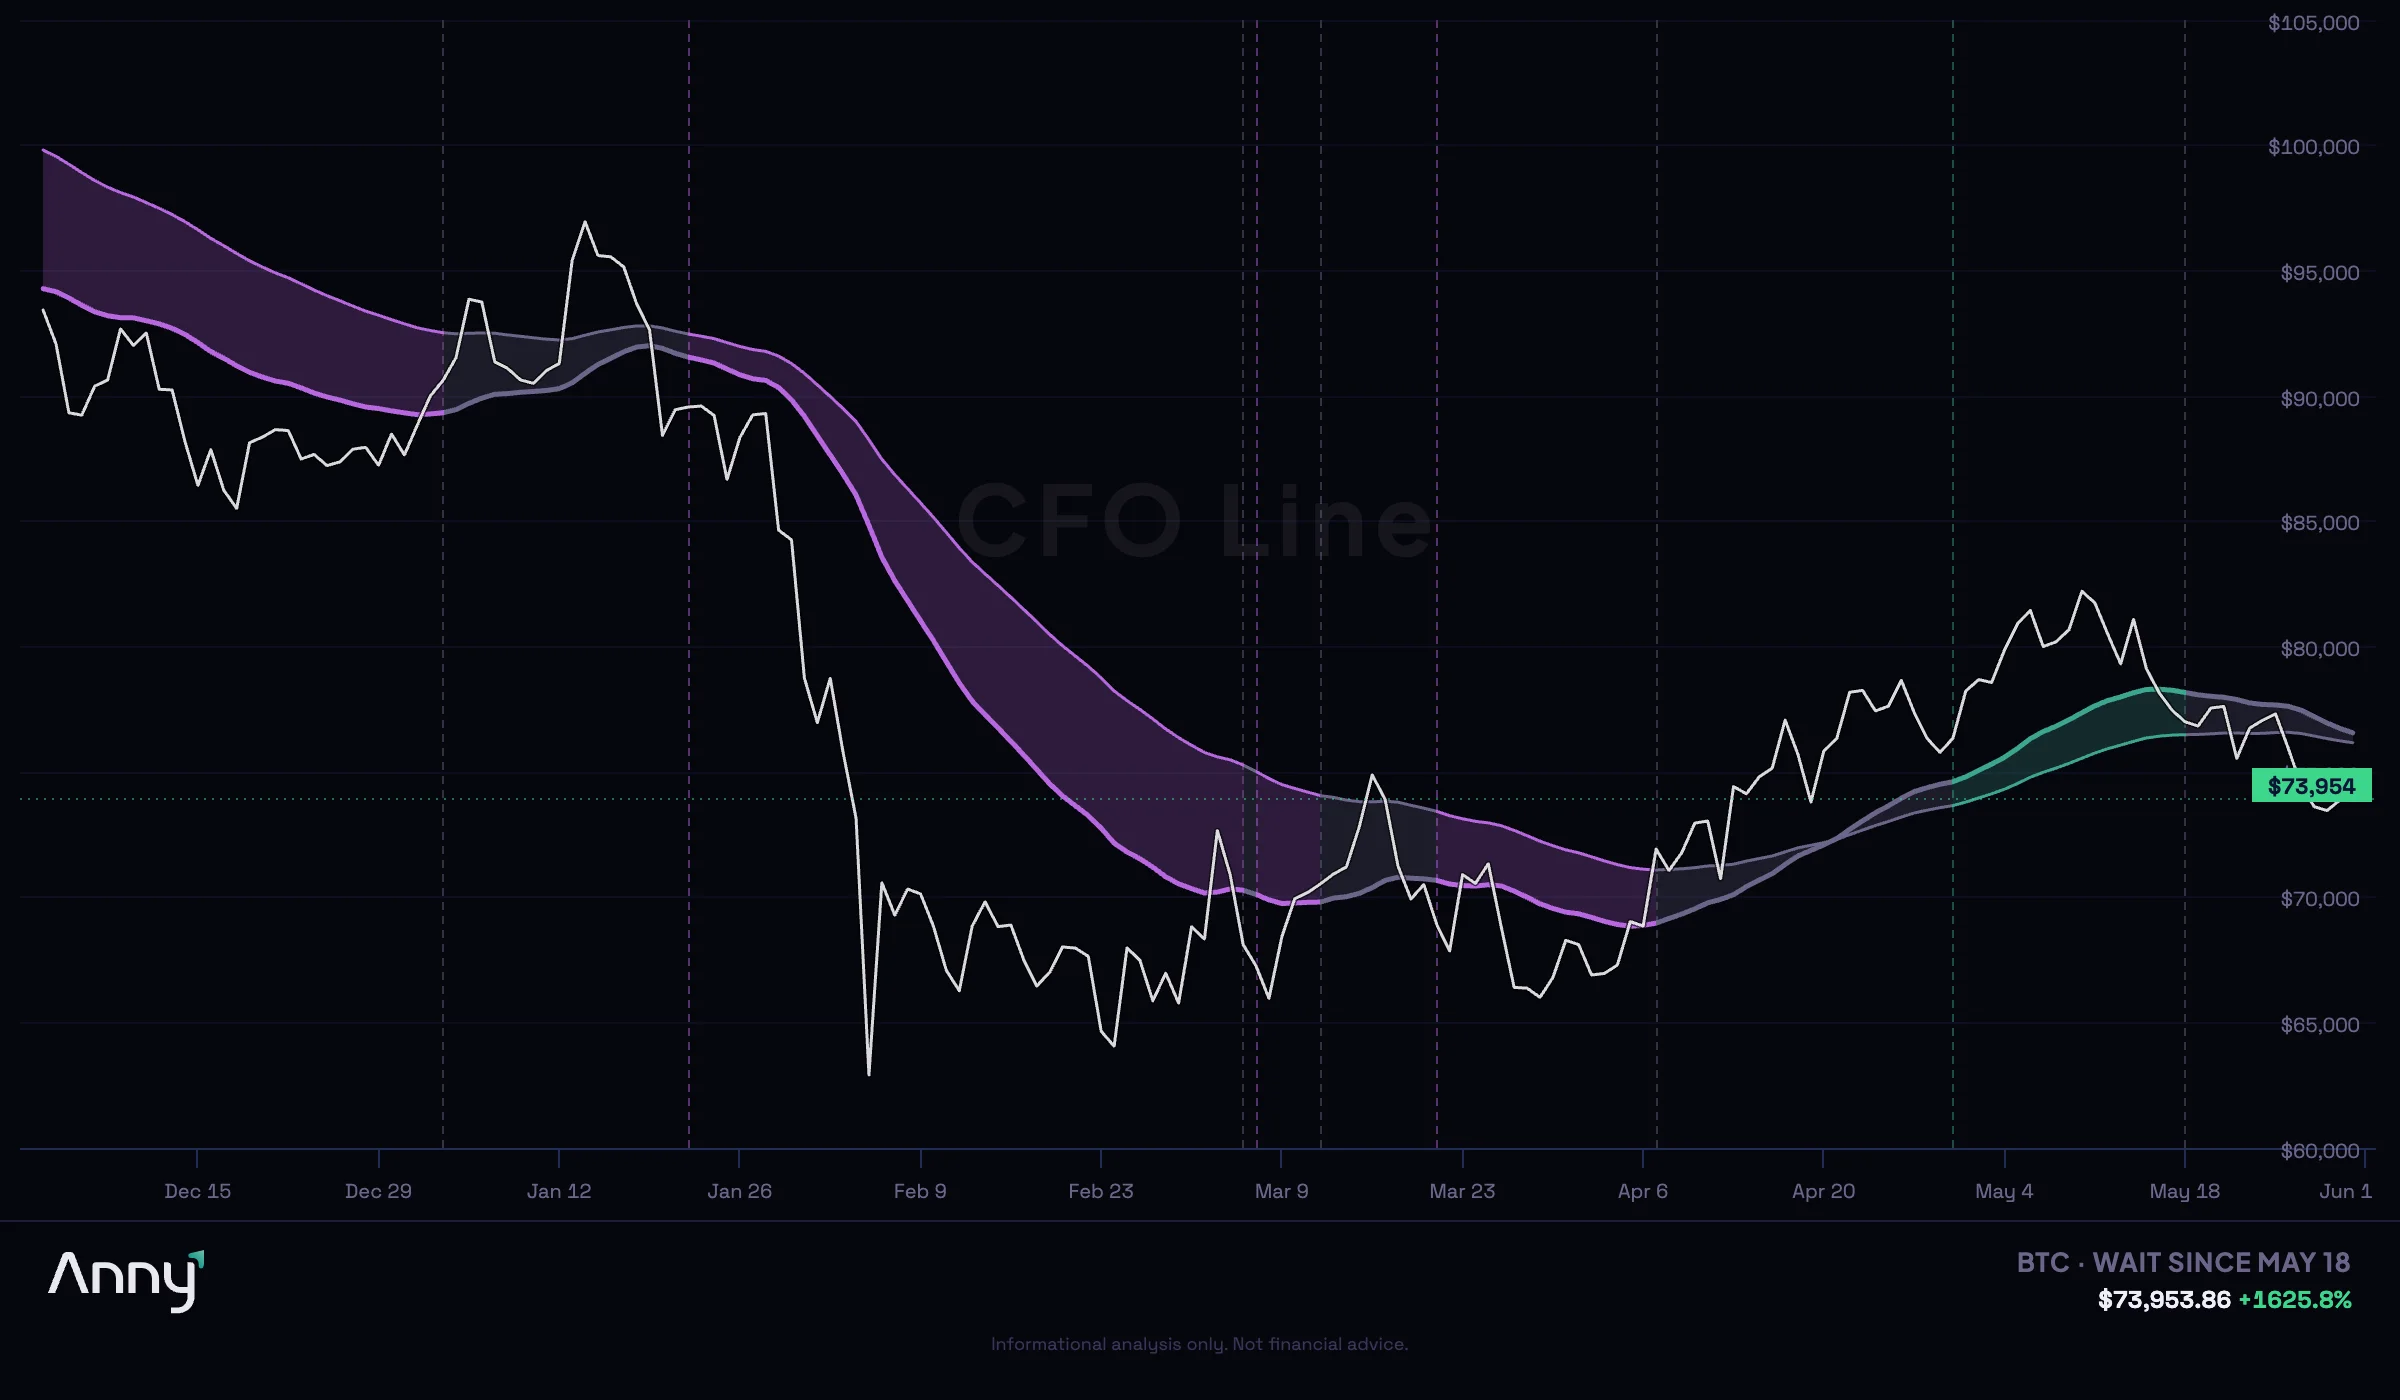
The CFO Line flipped to Accumulate on April 30. I published a full analysis on May 3 laying out the case, the risks, and exactly what would invalidate the signal. Price ran from ~$76,300 to a peak of ~$82,400 on May 6 — roughly an 8% move in six days. By May 22, it had given all of it back. The CFO Line is now back in Wait. Accumulate lasted exactly 26 days.
Here is exactly what my data shows about what happens next. Full disclosure: the CFO Line is Anny's proprietary indicator. I will explain the methodology in general terms below, but the exact parameters are not public. Judge the analysis on the data, the logic, and the track record — not on blind trust.
What I Said on May 3 — And What Actually Happened
When the CFO Line flipped to Accumulate on April 30, I published a full analysis the same week. Here is the honest scorecard.
What I said was working:
- Signal emerged from a 24-day gray compression — meaningful consolidation before resolution. ✅ True. The compression was real.
- Two prior Distribute signals had failed, suggesting sellers were losing conviction. ✅ True at the time. Sellers did lose conviction — temporarily.
- Price holding above the flip level ($76,347). ✅ Held for 6 days, reached $82,400.
- Fear & Greed at 47 (Neutral) — no euphoria priced in. ✅ Correct. Entry sentiment was favorable.
What I said to watch:
- The spread at 1.57% was narrow and needed to resolve. ⚠️ It resolved — upward initially, then collapsed.
- BTC at the top of its 30-day range ($67,300–$78,687). ⚠️ Price broke through the ceiling to $82,400, then failed to hold the new range.
- "4 days into the signal is early. Conviction builds over time, not in one candle." ✅ This was the right caution. Conviction never built.
What I said would invalidate the signal:
- Price loses the flip level at $76,347 and closes below $75K. ✅ This happened. BTC hit $74,500 on May 22 — below both thresholds.
- A flip back to gray within 7–10 days would mean unresolved compression. ❌ The flip back to gray took 26 days, not 7–10. The signal survived longer than the quick-invalidation window.
- A rapid move to purple without a meaningful rally. ❌ Did not happen. There was a meaningful rally (+8%) before the reversal.
The base rate table I published:
7 out of 8 comparable gray-to-green flips (gray periods of 11+ days) had been positive at 6 weeks. The two negatives were -12% and -23.7%. I noted: "The difference between them wasn't the signal length — it was the macro context at the time. That's on you to assess."
The actual 6-week return from April 30: BTC went from $76,347 to ~$76,600 by the 6-week mark. Essentially flat — roughly +0.3%. Not one of the strong positive outcomes. Not one of the deep negatives either. The macro context I flagged as the differentiator turned out to be the deciding factor: $1.26B in ETF outflows and the worst demand reading of 2026 prevented the signal from confirming.
Bottom line: The entry was sound. The exit timing worked — the CFO Line flipped back to Wait before the worst of the drawdown to $74,500. If you followed the signal both ways, you entered near $76,300, had the opportunity to take profits near $82,400, and were told to step aside before price cratered. If you held through the full cycle, you are roughly flat. The signal did not deliver the base-rate outcome. It did protect capital.
How the CFO Line Works
The CFO Line analyzes daily price data through multiple structural layers. When the faster layers cross above the slower layers and the spread between them widens, the signal reads Accumulate — the structure favors buyers. When they compress or invert, the signal shifts to Wait or Distribute. The exact methodology is proprietary.
It is a trend-structure indicator. It does not chase momentum or react to single-day moves — it measures whether the underlying price structure favors directional positioning. Think of it as a regime classifier: is the trend intact, ambiguous, or reversing?
The April 30 flip to Accumulate was clean. The bands expanded as price broke above $76,352. Price confirmed almost immediately. Then the macro environment reasserted itself, and the bands compressed back through the entry. With price retreating below $77,000, the faster bands fell back below the slower ones — and the signal flipped to Wait.
This is the signal doing exactly what it is designed to do: it told you when structure changed, in both directions.
The 26-Day Accumulate Window — 9 Years of Context
The CFO Line dataset now spans 3,205 daily candles from August 2017 to May 2026 — nearly 9 years covering the 2017 bull, 2018–2019 bear market, the 2020 COVID crash, the 2021 bull, the 2022 bear, and the 2023–2026 recovery cycle. Across BTC, ETH, SOL, and AVAX, the dataset contains 587 regime flips.
Here is what that data shows about the current situation.
BTC Accumulate windows average 25.8 days (range: 1–111 days). This 2026 Accumulate lasted 26 days — right at the historical average. It did not fail unusually fast. What is unusual is that it failed to confirm: price ran 8% and then gave it all back. The average Accumulate window that lasts 26+ days produces a positive 7-day return 78% of the time. This one ended flat.
Seasonal context:
- 2024 summer (May 1 open to Sep 30 close): 26 Accumulate days. Summer return: +4.4%. A rangebound grind.
- 2025 summer: 95 Accumulate days — the regime held decisively. Summer return: +21.1%. A cleaner trend.
- 2026 so far: 17 Accumulate days, 9 Wait days — and the Accumulate state has already reversed.
2026 is beginning to resemble 2024's rangebound structure: in 2024, the CFO Line spent 51% of tracked days in Wait, the highest concentration in my dataset.
The full accuracy picture — filtered for regimes lasting 10+ days (noise removed):
| Metric | Value |
|---|---|
| Directional flips (Accumulate + Distribute) | 193 |
| 7-day directional accuracy | 73.1% |
| Accumulate → positive 7d return | 78.0% (71 of 91) |
| Distribute → negative 7d return | 68.6% (70 of 102) |
| Return asymmetry ratio | 2.47x |
| Avg correct move magnitude (7d) | 10.3% |
| Avg incorrect move magnitude (7d) | 4.2% |
That asymmetry ratio is the number that matters most. When the CFO Line is right, the average move is 2.47 times larger than when it is wrong. Over 193 directional calls across 9 years and 4 assets, the signal does not need to be right every time — it needs the wins to be bigger than the losses. They are.
The Macro Headwinds That Compressed the Signal
This is not a chart problem in isolation. The structural demand environment has deteriorated to the weakest readings of 2026.
- Six consecutive days of ETF outflows totaling $1.26B (May 11–17), per CryptoTimes. BlackRock's IBIT alone shed $448M in a single session. This is sustained institutional withdrawal, not a single-day anomaly
- 30-day apparent demand: -147K BTC — the weakest demand reading of 2026, per CryptoQuant. This metric measures net buying minus selling flows over 30 days — a negative reading means more BTC was sold than bought
- Inflation running hot — April CPI came in at 3.8% and PPI at 6%, per the Bureau of Labor Statistics. Rate cut expectations have been pushed back, keeping monetary policy as a headwind for risk assets
- 30-year Treasury yield above 5.1% — at this level, the yield on long-duration government bonds becomes a real competitive factor for institutional allocators deciding between BTC and fixed income
- Corporate BTC accumulation has slowed — per CryptoQuant on-chain data, the pace of new corporate treasury allocations dropped meaningfully in the second half of May, reducing a demand layer the market had priced as persistent
Fear & Greed has spent the entire past week in Fear territory, touching Extreme Fear on May 24 (reading: 25) before recovering slightly to 34. That is still solidly in Fear. Historically, extreme fear readings have preceded both sharp reversals and extended drawdowns — fear alone is not a directional signal.
Is It Too Late for Summer?
This is the question everyone is avoiding. The CFO Line has flipped to Wait in the April-June window six times in the last 9 years. Here is what happened to the rest of summer each time.
Summers that recovered:
| Year | Wait lasted | Re-flipped to Accumulate | Summer return |
|---|---|---|---|
| 2020 | 2–12 days | Within days, choppy gold/gray churn | +25.0% |
| 2024 | 10–108 days | Slow grind, Distribute phases mixed in | +4.4% |
| 2025 | 1–6 days | Near-instant re-flips, trend held | +21.1% |
Summers that did not recover:
| Year | Wait lasted | What happened next | Summer return |
|---|---|---|---|
| 2021 | 12–92 days | Flipped to Distribute within weeks, full crash | -24.0% |
| 2022 | 284 days | Never came back. Full bear market. | -48.4% |
| 2023 | 5–48 days | Mild drag, sideways | -7.8% |
The pattern is clear. When the Wait state re-flipped to Accumulate within 1–2 weeks (2020, 2025), summer was strong. When Wait lasted more than a month or flipped to Distribute (2021, 2022), summer was negative. 2024 was the middle ground — a long churn with Distribute phases, barely positive at +4.4%.
Where 2026 stands: The flip happened 8 days ago. The clock is running. On-chain data from CryptoQuant shows whale-tier wallets at their 2026 peak, and the Whale vs. Retail Delta divergence is the widest since November 2024. ETF flows and on-chain wallets are telling opposite stories — institutional conviction is not monolithic.
We are 8 days into this Wait state with no re-flip. The quick-recovery playbook (2020, 2025) required re-flips within days — that window is closing. The most realistic analog right now is 2024: a long, rangebound grind that ended the summer barely positive at +4.4%, with Distribute phases mixed in along the way. The risk case — 2021/2022 — remains on the table if the CFO Line flips to Distribute before mid-June. Q1 already closed at -22%. This is not a market with room for another structural failure.
What I Am Watching
Three things need to happen for the summer to work:
- The CFO Line needs to re-flip to Accumulate before mid-June. Every positive summer in the dataset had a quick re-flip. Every negative one did not.
- ETF flows need to stabilize. Six consecutive outflow days totaling $1.26B is the immediate headwind. The selling must exhaust.
- The bands must not invert. If they compress further and flip to Distribute, the 2021/2022 pattern takes over.
- BTC Has Crashed in Q1 Seven Times. Only 3 of Those Summers Were Green.
- Buy the Trend, Not the Price
- Render Network Just Flipped to Accumulate: 60,000 New GPUs, a CFO Signal, and What the CFO Line Sees
The question is not whether BTC eventually moves higher. The question is whether the current structure supports a position. Right now, my CFO Line says it does not — not yet.
The discipline is the edge. Wait for the signal.
Check your CFO Line now — see the current regime state for every asset in your portfolio, updated daily.
The CFO Line is Anny's proprietary trend-structure indicator. Current state: Wait. Regime data spans August 2017 to May 26, 2026 (~9 years, 3,205 daily candles for BTC). Cross-asset accuracy statistics are computed across BTC, ETH, SOL, and AVAX (587 total flips). Anny is an AI-powered analytics platform.
BTC/USDT live rate · ETH/USDT live rate · SOL/USDT live rate
Related reading:
This analysis is for educational purposes only — not financial advice. Past performance does not indicate future results. Statistics cited are from analysis of historical data and may not reflect future market conditions. Anny is an AI-powered analytics platform, not a registered investment adviser. Crypto assets are volatile and you can lose your entire investment.
Want Anny's AI to analyze your portfolio? Try the Anny Line or see pricing.